Map of Supermassive Black holes by LOFAR/LOL Sky Survey
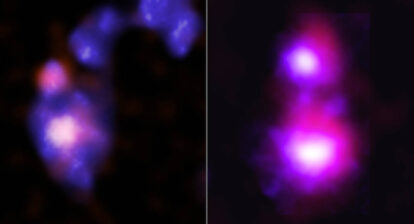
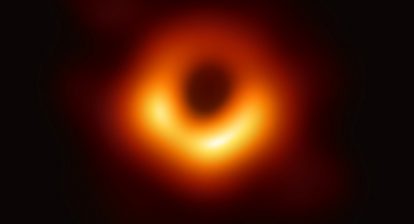
WOW! This view of the nightsky does not depict stars – these are supermassive black holes. An international team of astronomers has published a map of the sky showing over 25,000 supermassive black holes. It is the most detailed celestial map in the field of low radio frequencies.
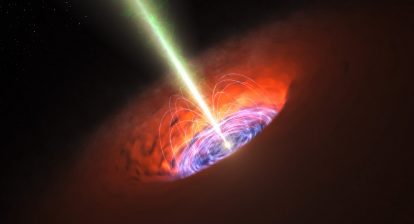
Each black hole is located in a different, distant galaxy. They can be observed due to the radio waves emitted by matter that was ejected as it got close to the black hole. We know black holes are…well black. But when matter gets close to one, gravity pulls material into the center of the black hole and we can see this material falling into it due to the electromagnetic radiation it emits. Scientists study stars orbiting or flying by a black hole. When they are close enough to it, they emit high energy light, which they can then observe with satellites and telescopes.
These black holes were mapped using LOFAR (Low Frequency Array) – currently the largest combined radio telescope in the world. It consists of 52 stations, with around 20,000 antennas spread over nine different countries: The Netherlands, Germany, Poland, France, the United Kingdom, Sweden, Ireland, Latvia and Italy. LOFAR is the only radio telescope network capable of deep, high-resolution imaging at frequencies below 100 megahertz. This means that the view it provides is different from any other.
A big problem is that the Earth’s ionosphere complicates observations at low radio wavelenghts for the Earth-based LOFAR. The ionosphere is a layer of free electrons and it basically acts like a cloudy lens that constantly moves across the radio telescope. Co-author Reinout van Weeren (Leiden Observatory) explains: “It’s similar to when you try to see the world while immersed in a swimming pool. When you look up, the waves on the water of the pool deflect the light rays and distort the view.”
 The astronomers used supercomputers and developed new algorithms that corrected for the effects of the ionosphere every four seconds. “This is the result of many years of work on incredibly difficult data. We had to invent new methods to convert the radio signals into images of the sky“, says research leader Francesco de Gasperin (formerly Leiden University, now Universität Hamburg, Germany).
(Stupendously Large Black Holes)
The map, resulting from years of software development, was created by combining 256 hours of observations and covers 4% of the northern half of the sky. The astronomers plan to continue until they have mapped the entire northern sky in ultra-low-frequencies, the LOFAR LBA Sky Survey (LoLSS).
In addition to supermassive black holes, this map also provides insight into the large-scale structure of the universe, reveal undiscovered or unexplored objects in the region below 50 megahertz and will help to bring about a greater understanding of the ionosphere itself.
The Paper: The LOFAR LBA Sky Survey – I. survey description and preliminary data release. By F. de Gasperin et al has been accepted for publication in Astronomy & Astrophysics.


